

The PQRST wave is a component of an electrocardiogram (ECG or EKG) reading. It provides information about the heart’s function. In many ways, the PQRST wave is the heart’s signature, which provides insight into its function and health. Understanding the PQRST wave meaning is critical to knowing what to do when someone is facing a heart-related emergency.
Most commonly used by medical professionals in an emergency setting, the following details of the PQRST wave can provide insight into what readings mean and what actions are often taken.
PQRST Wave: What a Normal EKG Strip Means
A normal EKG rhythm strip is a graphical representation of the heart’s function, specifically its electrical activity over some time. Numerous waves and intervals display various phases of the cardiac cycle on this strip. These need to be interpreted to determine if heart function is normal.
When a person’s EKG strip is normal, the waves and intervals between them and all related measurements are as expected, meaning the heart function is proper. Any differences or deviations from normal rhythm indicate a potential problem with the electrical system, which often needs to be corrected.
The Types of Waves Seen in an EKG
To understand the details of these waves, we need to learn the four specific types of waves present on an EKG. Each of these waves offers details on atrial and ventricular electrical activity and helps to determine the underlying cause of any abnormalities that may be present in cardiac health.
- P-wave: This is a representation of the atrial depolarization or the contraction (squeezing) of the atria or top chamber of the heart. It is a small, upright deflection that occurs before the QRS complex.
- QRS Complex: This is a representation of ventricular depolarization, which indicates when the ventricles contract. There are three distinct deflections present: the Q-wave, R-wave, and S-wave.
- ST Segment: This is a representation of the first portion of ventricular repolarization. This is a flat, isoelectric section that is positioned between the QRS complex and the T-wave.
- T-wave: This is a representation of ventricular repolarization, which is the recovery of the ventricles after contraction. It is a rounded, upright deflection that follows the ST segment.
How PQRST is Determined
When considering P wave, QRS Complex, T-wave, and other components, it is essential to understand where this all stems from. How is the PQRST determined?
To determine the PQRST sequence, practitioners must analyze the timing, morphology, and duration of each of these waves, as well as the interval present on the EKG rhythm strip. The normal range for each part is different but must be understood to identify any deviations that could indicate heart complexities.
Let’s break down the details of each component of PQRST to provide insight into how to determine whether it is normal or requires care.
First, the ECG provides us with this information. Though more complex versions exist, a single, 12-lead electrocardiogram contains extensive information, providing indications of very subtle differences in the way the heart’s electrical system functions.
The ECG traces the electrical activity taking place within the heart at that exact moment. When a heart is beating normally, an electrical impulse comes from the sinoatrial node at the top of the heart, spreads to the atrium, or the top chamber of the heart, and then to the atrioventricular node. Once there, the electrical pulse travels to the ventricular septum of the heart, causing the contraction. As the electrical impulse travels across the heart, it causes the four chambers to contract and relax in an ordered fashion, allowing blood to move through the heart.
To understand the differences, consider the following details about each component of the PQRST wave.
P Wave
As noted, the P wave is the depolarization of the left and right atrium. It indicates the contraction of the atrium. The atria contract a second after the P wave begins. It is very small, and as a result, it is not possible to see atrial repolarization on the ECG.
The P Wave should be smooth with a rounded top. It should be 2.5 mm tall at most, and in terms of duration, it should last 0.11 seconds or less. It is positive in leads I, II, aVF, and V1 through V6.
QRS Complex
The next component of the PQRST wave is the QRS Complex. What does the QRS wave in the electrocardiogram (ECG) represent? This represents the Q wave, R wave, and S wave. These happen quickly in rapid succession. This occurs when the electrical impulse spreads through the ventricles. It shows that ventricular depolarization is occurring. It begins just before ventricular contraction takes place.
Not every QRS complex will contain all three elements. The Q wave is always negative, and the R wave is the first positive wave within the complex. In situations where there is only a positive deflection or upward deflection, then that is indicative of the R wave. The S wave is the first negative deflection, or downward deflection, after the R wave.
In a normal rhythm, the duration of the QRS complex will last from 0.06 to 0.10 seconds, and it will be positive in leads I, aVL, V5, V6, II, III, and aVF. It is typically negative in aVR, V1, and V2.
Also notable in this complex is the J point. This is the point where the QRS complex and the next component, the ST segment, come together. It’s the start of the ST segment. You’ll hear it sometimes called a Junction. It’s a critical component because it can indicate damage to the heart.
T Wave
The next component of this process is the T wave. It comes right after the QRS complex and is representative of ventricular repolarization. A normal T wave will be slightly symmetrical. That means the peak or highest point of the wave is closer to its end than it is to the beginning. T waves are generally positive in leads I, II, and V3 – V6 and and may vary in other leads.
Typically, the T wave will follow the same QRS complex that came before it, such as positive or negative. In situations where the T wave does not do this and instead is in the opposite direction of the QRS complex, that indicates complexity and irregularity.
Learning the Details
Each component of the heart’s electrical function provides insight into what could be happening with it.
With every beat, the heart is working to depolarize to trigger a contraction. That electrical pulse must travel through the heart’s various chambers to create the desired function.
When you learn how to complete an ECG, you will learn the details of lead placement and function. 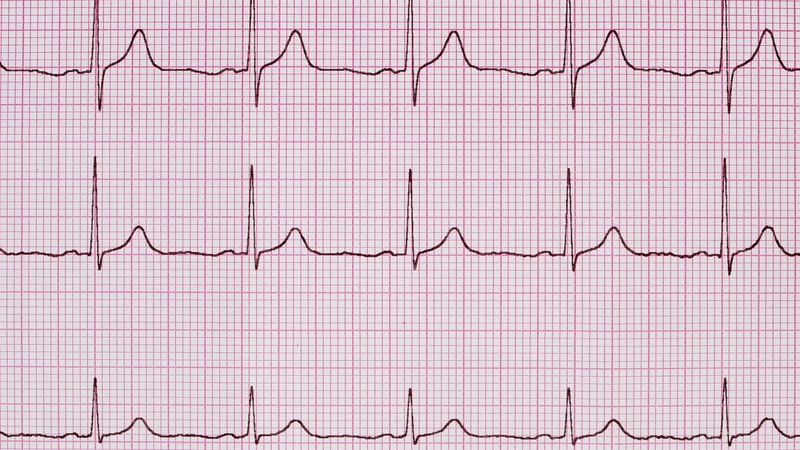
Consider the following as a quick reference for analyzing a PQRST EKG strip. This is a five-step system. With the information you receive, you can then refer to cardiac guides to determine the underlying problems or concerns present, if any.
- Confirm P Waves: The first step is to determine if P waves are present. If they are, you move on to the next step.
- Look at QRS waves: Confirm the presence of QRS waves. These should be narrow and should last no longer than 0.12 seconds.
- PR Interval: Consider if the PR Interval is in the normal range. The PR interval measures the time from atrial depolarization to ventricular depolarization (when the lower chambers contract). It should range from 0.12 to 0.20 seconds.
- Calculate the heart rate: This is the beats per minute. To do this, count the number of R waves in a six-second strip. Then, multiply it by 10.
- Classify the rhythm: Is the rhythm regular or irregular?
Interpreting PQRST Waves
For those who are ready to become rescuers and perhaps even take an ACLS or PALS certification, it may not be necessary to analyze these types of PQRST waves. That is often done within a hospital or cardiac care center. However, for those working in these fields, it will be critical to not only capture this information using an EKG but also read and understand its meaning.
After completing the five-step process noted earlier, you can use those findings to make decisions about what you see. Here are some factors that can contribute to the changes you make.
Arrhythmias
 This indicates that the heart is not beating as it should. There are several differences that could potentially occur:
- A fast rhythm, but the PQRST wave configuration is normal: Sinus tachycardia
- Absence of P waves, irregular rhythm: atrial fibrillation
- Wide QRS complexes without visible P waves: Ventricular tachycardia
Ischemia and Infarction
Ischemia refers to a location where the flow of blood is reduced. Infraction occurs when there is an area of the heart where blood flow is completely cut off, causing the death of cells.
- ST elevation: This indicates acute STEMI
- ST depression and T wave inversion: Indicates myocardial ischemia
Electrolyte Imbalances
In some situations, the electrolytes necessary to keep the heart pumping normally are not balanced. This includes, for example, potassium.
- Peaked T waves and widened QRS complex indicate hyperkalemia
- Flattened T waves and prominent u waves: Hypokalemia
Abnormalities in Conduction
In these situations, some components of the electrical system are not operating properly, and the conduction does not follow the expected path.
- Widened QRS complex with a specific pattern: This indicates bundle branch block
- Prolonged PR interval: First-degree AV block
Frequently Asked Questions
To help you navigate the complexity of the PQRST wave, we’ll tackle some of the most common questions about these elements.
What is PQRST wave meaning?
The PQRST wave meaning is the wave pattern on an ECG that shows the function or electrical activity of the heart. The letters represent the various components of the cardiac cycle – P wave, QRS complex, and T wave.
What is the PR interval normal range?
The normal PR interval range is typically between 0.12 and 0.20 seconds. This represents the time it takes for the electrical signal to move from the atria to the ventricles to the atrioventricular node.
What is the normal QRS interval?
The normal QRS interval is 0.08 to 0.10 seconds. Any longer than this is considered abnormal. This represents the time it takes for the ventricles to depolarize or activate. When the QRS interval is short, it depolarizes quickly, meaning the heart’s electrical system operates normally.
What does the QRS duration mean?
The QRS duration is the length of time it takes for the ventricles to depolarize or contract. When this is longer than normal, it can indicate a problem with the heart’s electrical conduction, such as a bundle branch block.
What is the QT interval?
Within the PQRST wave, the QT interval refers to the length of time it takes for the ventricles to fully depolarize and repolarize. This provides insight into heart muscle contraction. A prolonged QT interval increases the risk of abnormal rhythms and sudden cardiac death.
What do U waves ECG indications mean?
A U wave happens when there is repolarization of the Purkinje fibers. This is not that common. However, it can be brought on by an imbalance in electrolytes.
What does the QRS complex represent in the ECG wave tracing?
The QRS complex represents the electrical depolarization of the ventricles. It typically shows when the heart’s ventricles are contracting and pumping blood out of the heart and into the body.
What is the QRS complex normal range?
The typical QRS complex normal range is between 0.08 and 0.10 seconds.
Why do P QRS T waves matter?
It is critical to monitor the heart’s function to determine if any concerns exist. If the heart’s electrical function is not normal, it can impact the heart’s ability to move blood through the heart and into the body. This can lead to a breakdown of function and, in some cases, sudden cardiac death.
Getting the Education You Need to Save a Life
At Save a Life, we offer a wide range of resources and tools to help you gain the education and training you need and maintain it to provide fast, reliable care to those who are facing an emergency situation. Explore all of our courses to find those most fitting for the type of experience and training you need.
We also offer a full ECG Rhythms course that can help you understand what is happening in your patient so you can provide the best level of support for them in that critical moment. Learn more about any of our certifications or contact us for additional support.


Thanks for breaking down the PQRST concept so clearly! It’s helpful to see what the different parts of an EKG signify. Just curious, is there a quick way to spot any major anomalies on a strip for someone who’s not medically trained? Or would this always require a professional to interpret accurately? Appreciate the informative read!